
April 3rd, 2026
business
The Economy
social-issues
monetary-policy
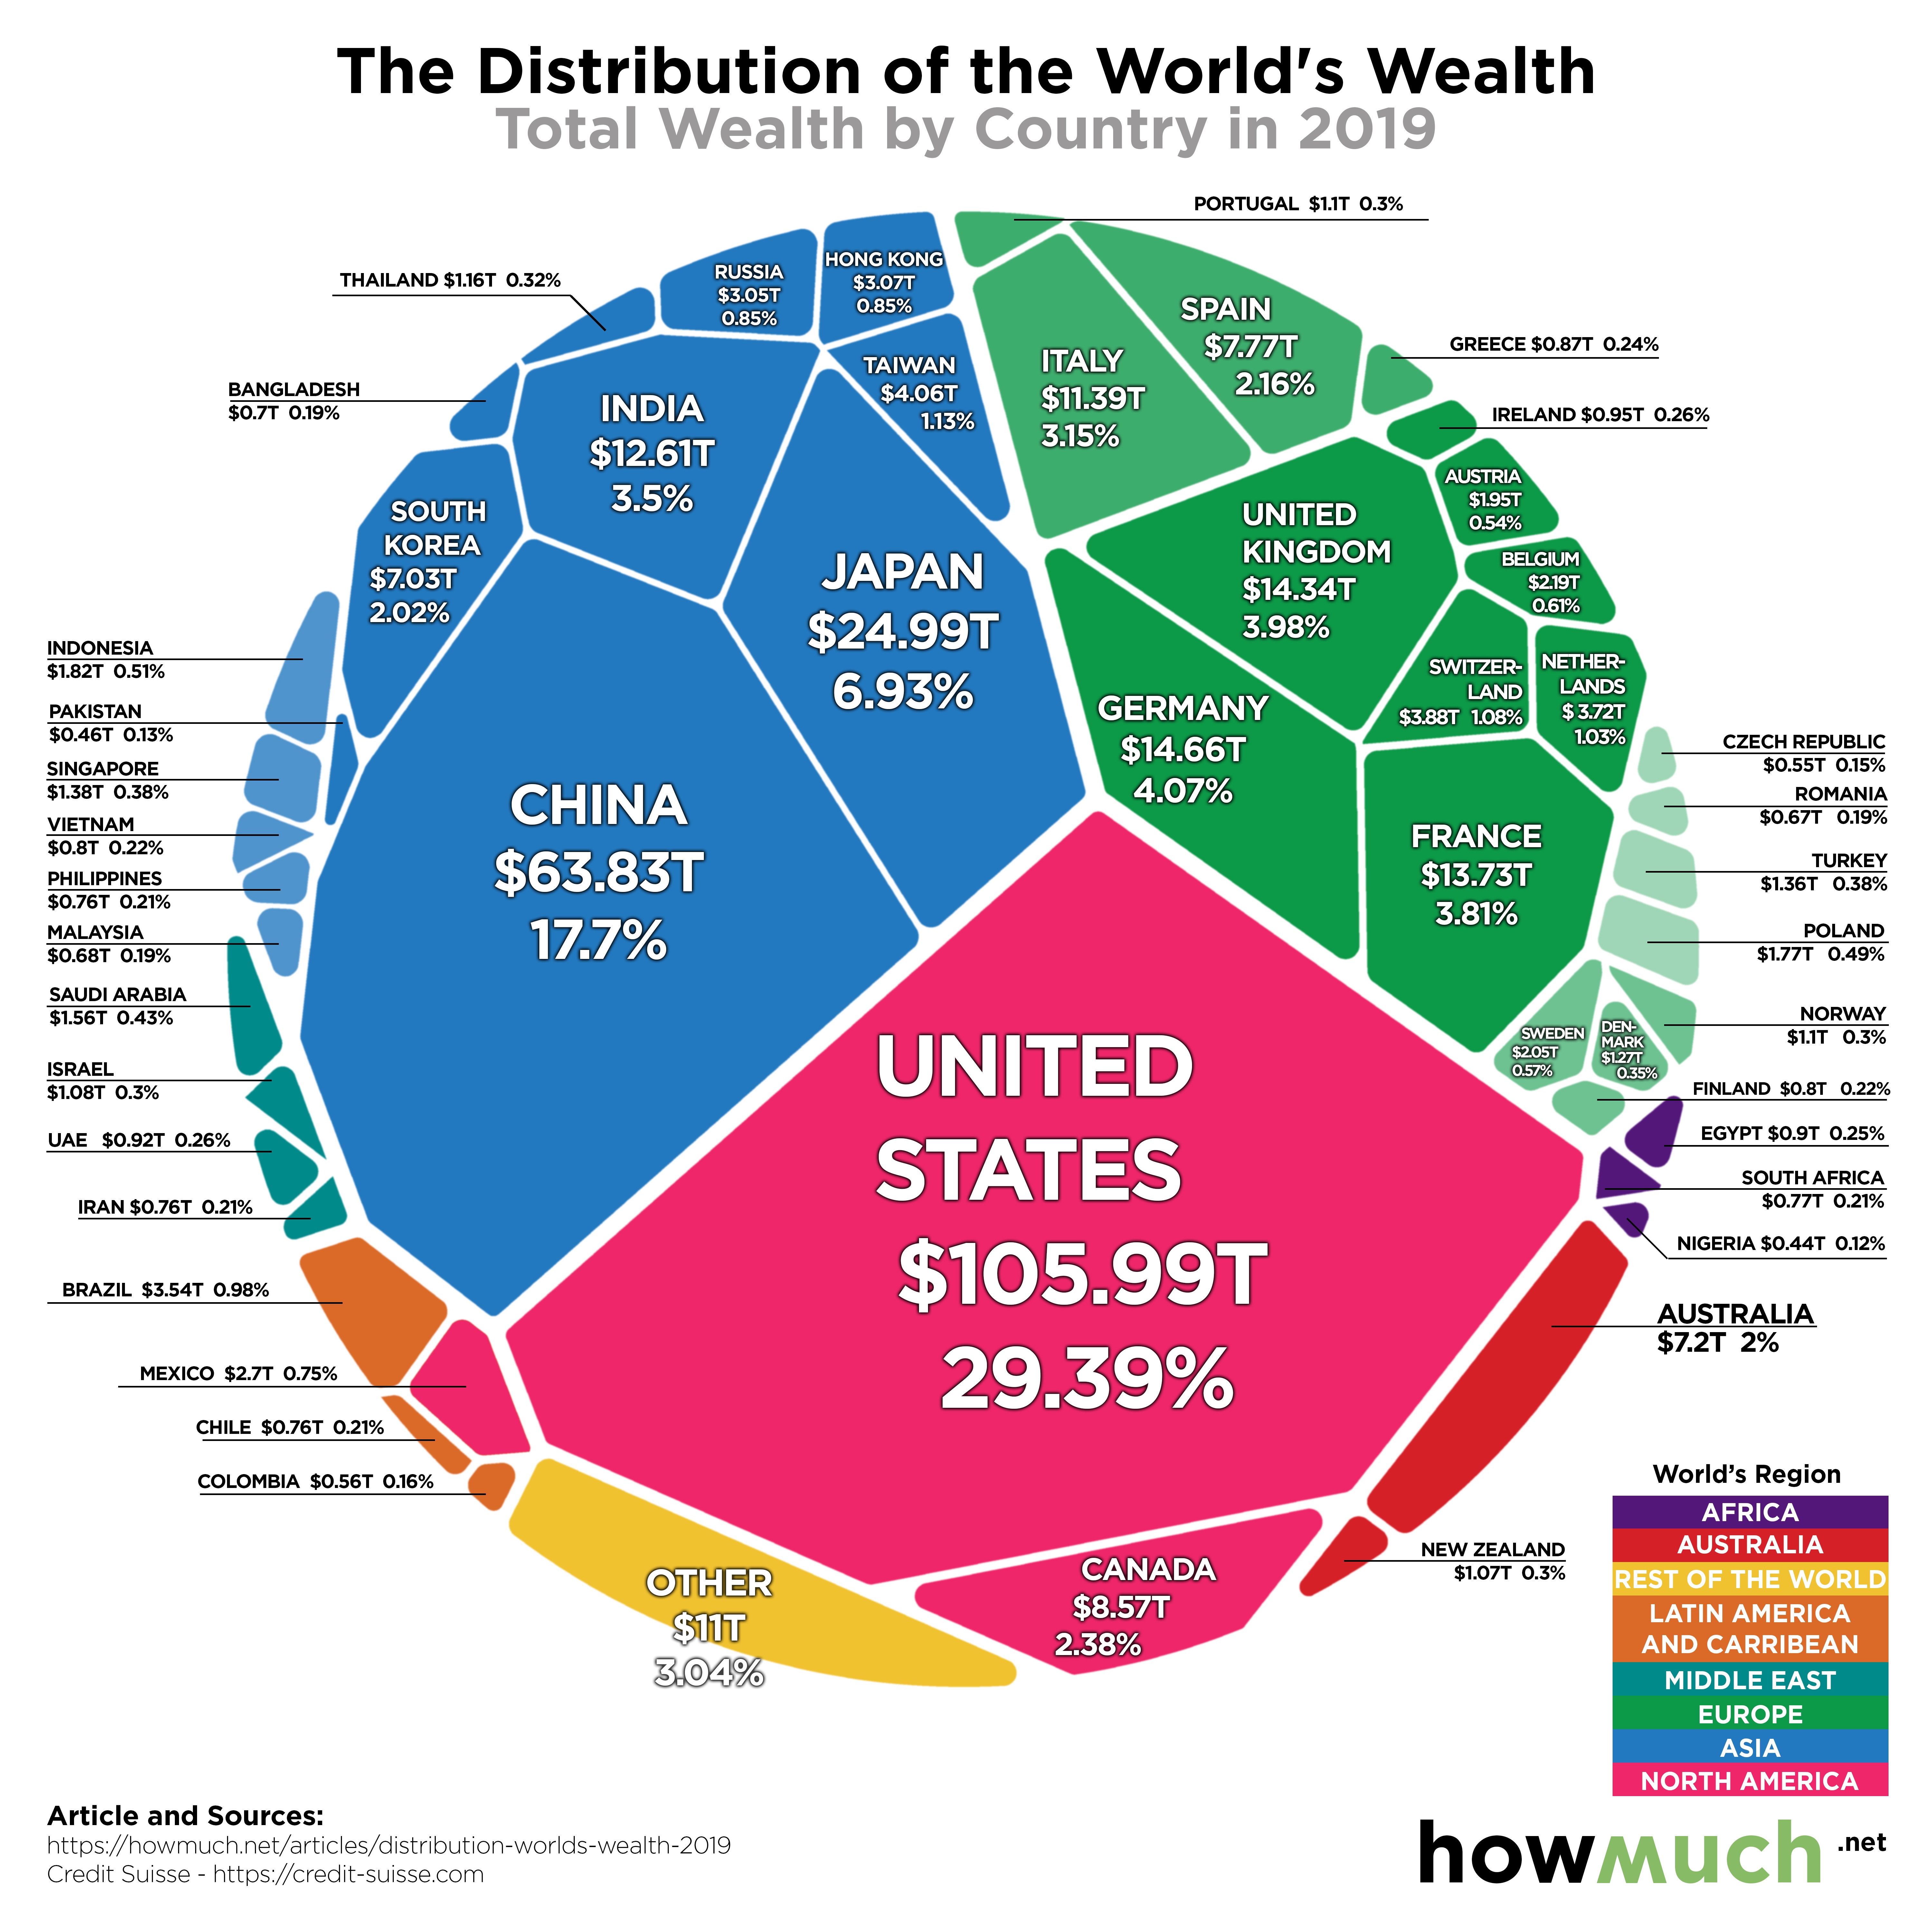
Wealth
February 2020 five visuals we wish we had created because they are that good!

April 3rd, 2026
business
The Economy
monetary-policy
What’s the best way to understand the relative size of the U.S. economy? American GDP is so big that individual cities generate as much economic activity as entire countries.

April 3rd, 2026
business
The Economy
investments
See where the top 100 brands in the world come from and which sectors dominate the ranking.

April 3rd, 2026
The Economy
trade
While the U.S. is categorized overall as a “net importer” of goods, these visualizations reveal that the balance of U.S. trade varies significantly from trading partner to trading partner

April 3rd, 2026
The Economy
cryptocurrencies
monetary-policy
Bitcoin is back over $10,000, but how does its liquidity compare to other asset classes? Our visualization puts things in perspective.

April 3rd, 2026
business
The Economy
investments
jobs
Public companies aren’t the only businesses to have an outsized effect on the U.S. economy. These private companies also command high revenues, as well as high employment.

April 3rd, 2026
The Economy
investments
trade
monetary-policy
How do the U.S. and China compare when it comes to world trading partners from 1980 until the present? Take a look at our helpful visualization to learn more.

April 3rd, 2026
business
The Economy
Wealth
The “Trillion Dollar Club” just welcomed its newest member. Here’s the full list of U.S. companies with the unique distinction of being worth more than $1 trillion.

April 3rd, 2026
The Economy
social-issues
trade
With the U.S. and Iran hitting the newswire, how do the two stack up economically, militarily, and population-wise? Our visualization highlights key metrics to show the size of the two countries side by side
April 3rd, 2026
business
The Economy
social-issues
Wealth
The world has a net worth of $360T. The U.S. economy continues to dominate given its sheer size, Asia and Europe are not that far behind.